 下载次数:630次 浏览次数:1295次发布时间:2018-01-08 11:00
DURRIDGE’s free CAPTURE software for Macintosh and Windows provides the ability to download radon data files from the RAD7 and issue commands to the RAD7 for performing various common tasks. A chart recorder renders sophisticated real-time graphs of radon and thoron data from single or multiple RAD7s. Included with CAPTURE is a complete user’s manual and several sample RAD7 data files. CAPTURE contains built-in support for the English and Chinese languages. Additional machine-generated language resources are available upon request.
CAPTURE can perform two-way communication with RAD7 devices containing RADLINK remote access software. Operating at up to 19.2 kBaud, RAD7 download operations are quick and easy.
CAPTURE’s extensive graphing features include advanced data navigation, multiple statistics panels, and enhanced selection abilities. Data may be exported to a variety of human-readable formats. High-resolution printer output is always just a click away.
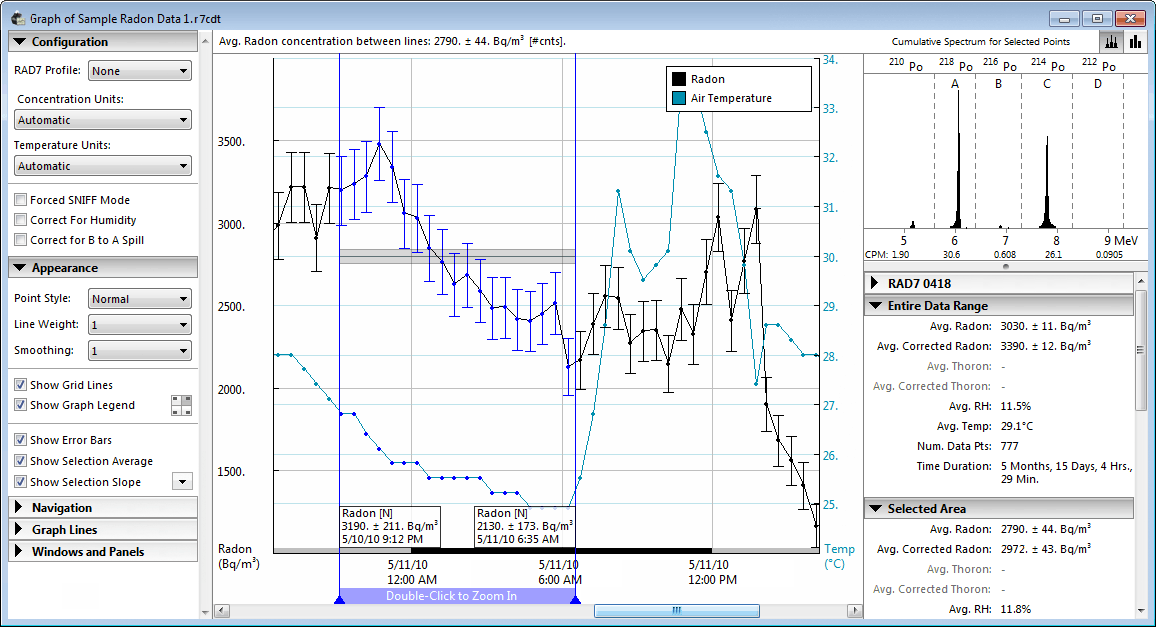
The Download RAD7 Data Panel makes it easy to obtain RAD7 test runs along with supplementary information needed for advanced data analysis. CAPTURE’s ability to control the RAD7 extends beyond the simple downloading of data: it is also possible to start and stop testing runs, obtain data summaries, configure the RAD7’s numerous settings, and obtain the RAD7’s serial number and calibration date. In fact, any command available on the RAD7’s physical keypad may be issued from within CAPTURE, whether the machine is located across the room or across the continent. CAPTURE chart recorderCAPTURE’s Chart Recorder displays a real-time graph of RAD7 data as it is recorded. As a radon test progresses, a set of virtual pens plot radon concentration, temperature, and humidity data on the right side of the display, while older readings scroll to the left. The Chart Recorder is accompanied by a Button Bar for starting and stopping tests and configuring RAD7 settings. Below the Button Bar is a Status Display panel indicating the current state of the RAD7. CAPTURE graph windowThe Graph Window displays radon, thoron, temperature, and humidity across a scrolling timeline. Auxiliary panels provide data navigation controls and statistics on the full data set and the selected portion. Graph data may be exported in several formats for use with spreadsheets and other software. CAPTURE graph parameters windowThe Graph Parameters Window is used to configure RAD7 data for graphing. CAPTURE supports data files generated using RAD7 accessories such as the RAD Aqua and Big Bottle System. By accounting for the physical parameters of the experimental setup such as tubing lengths and temperature data, CAPTURE can calculate radon and thoron concentrations in water. CAPTURE preferences windowCAPTURE’s Preferences Window provides controls for changing how CAPTURE behaves when connecting to RAD7s, downloading RAD7 data, and formatting the downloaded information. Here you can also define device profiles based on your RAD7 calibration records, and configure the program’s ability to read third party data files produced by RAD7 accessories. CAPTURE spectrum panelThe Spectrum Panel displays a synthetic representation of the spectrum printed out by the RAD7. It indicates alpha energies signaling the presence of radon and thoron daughter particles.
¥3500.00
¥1500.00
¥6900.00
¥3400.00
¥9900.00
¥4000.00
¥54000.00
 |  |  |