
 下载次数:399次 浏览次数:854次发布时间:2019-01-28 20:10
In this example, the Particles Per was set to “cubic foot” so that the data is
displayed in particles per cubic foot format which is 100 times the numbers
displayed on the LCD of the DC1100 itself. The software merely adds two
additional zeroes to the end of the numbers received from the DC1100 in order to
format the data into particles per cubic foot.
The data from the DC1100 is broken into three sections – minute history, hour
history, and day history corresponding to the same data that can be accessed
from the DC1100 front panel via the minute, hour, and day history modes
respectively. The minute history is labeled MIN, the hour history HR, and the day
history DAY. The following is an abbreviated example output:
The most recent data is listed first so that 26500/2400 was the particle
concentration one minute ago and 22200/1200 was the concentration two minutes
ago, etc. Same is true for the other history sections. At some points in the history
output the words “TIME BREAK” will likely occur. A TIME BREAK is inserted
into the history whenever the continuity of time is broken in the data history.
The DC1100 internal time clock only runs when the unit is plugged in to AC power.
Thus, when the unit is unplugged and then plugged in again it loses track of the
time relationship between any new data stored and old data. For example, in the
above example the DAY history of 34400/1700 is known to be the sample stored
for the previous day, however, the 58800/6500 data could have been two days
ago or 2 months ago depending on how long the unit was unplugged.
You now have the option to view the history within the window or store it to the
Log file. You also have the options to overwrite the existing data in the log file and
to graph the data in the graph window. As stated before, the data lacks the proper
time stamping and format to graph properly, but nevertheless, some users might
find graphing useful. The following screenshot shows how the download in the
example will graph:
SKC 761-203 PEM切割头,PM2.5,2升/分钟
¥5672.00
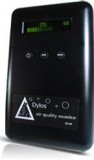
美国进口Dylos DC1100空气质量PM2.5粉尘检测仪,10台起订
¥2000.00
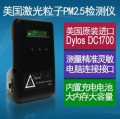
美国原装Dylos DC1700空气质量PM2.5粉尘检测仪
¥3900.00
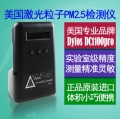
美国进口Dylos DC1100 Pro空气质量PM2.5粉尘检测仪
¥2900.00
¥3200.00
 |  |  |